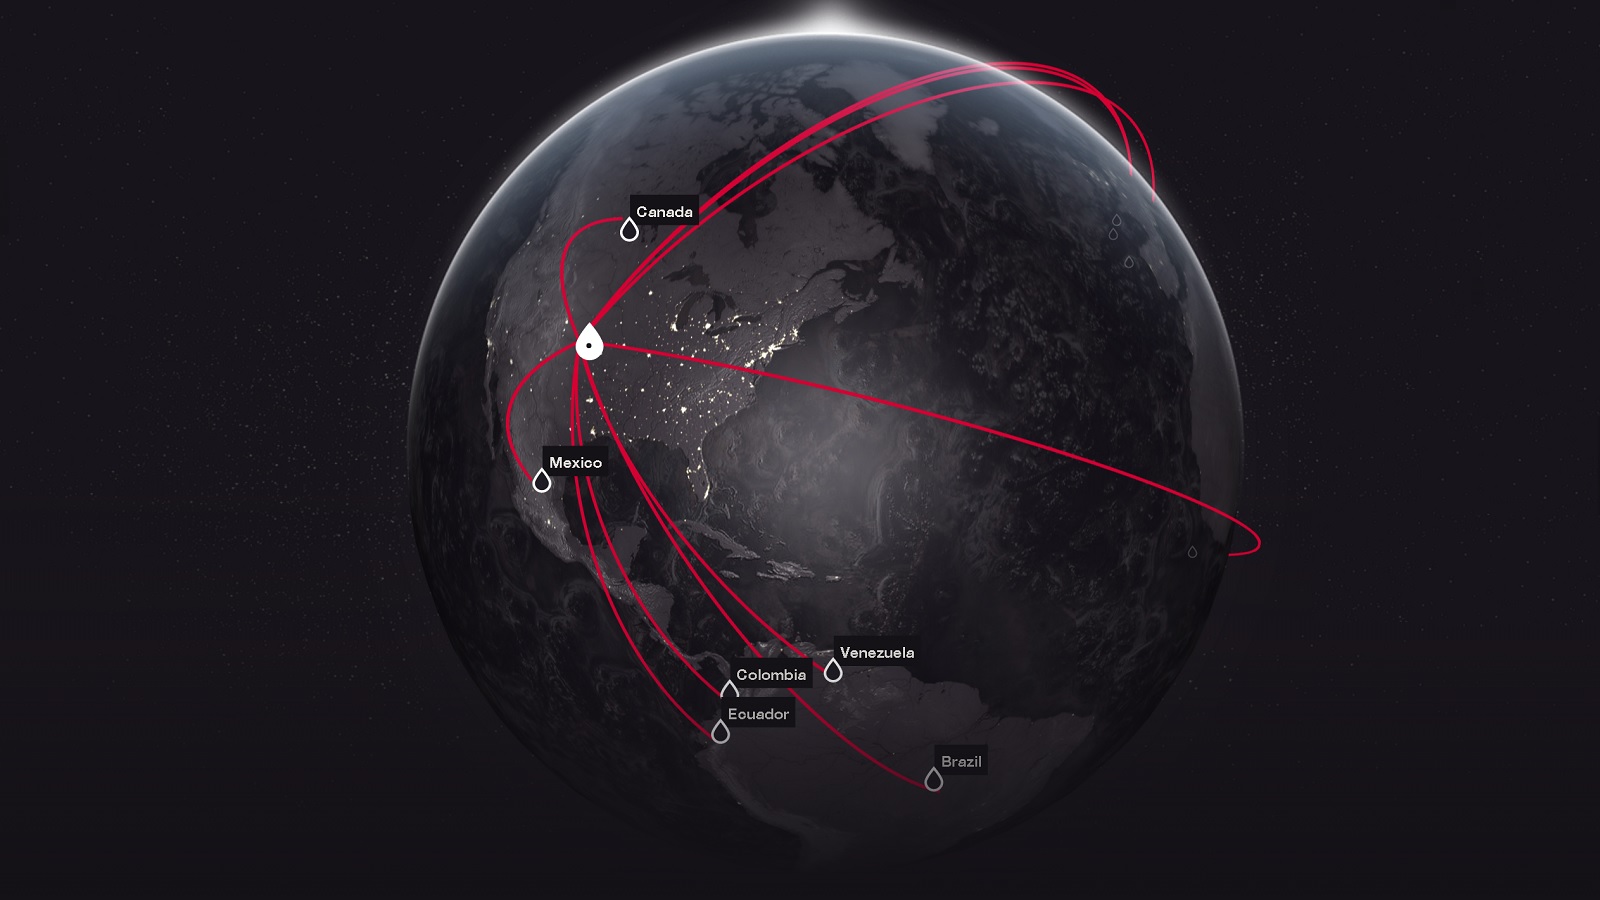
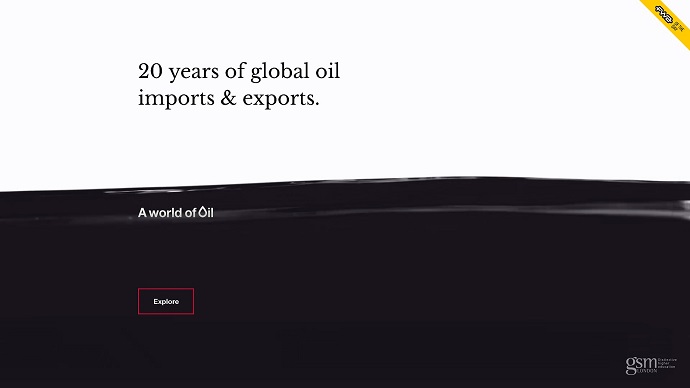
Crude oil is the world’s single most actively-traded commodity and UK-based digital design and strategy agency Epiphany Research has created an interactive tool in a form of a global map that shows oil consumption over the last decade, and the biggest importers and exporters. The revolving 3D earth provides both visual appeal and a stage for displaying data that was produced by the agency for London’s independent school of higher education, GSM London , and its oil and management college degree program.
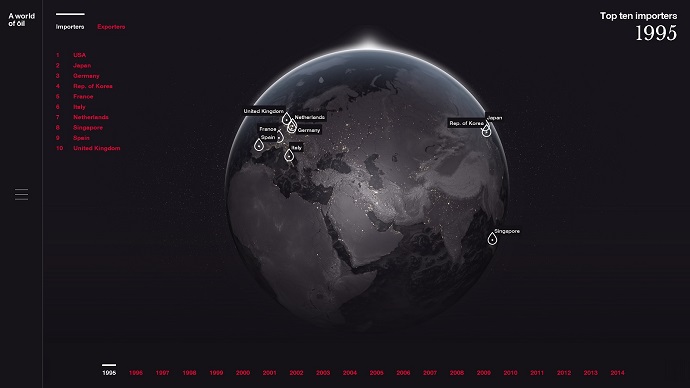
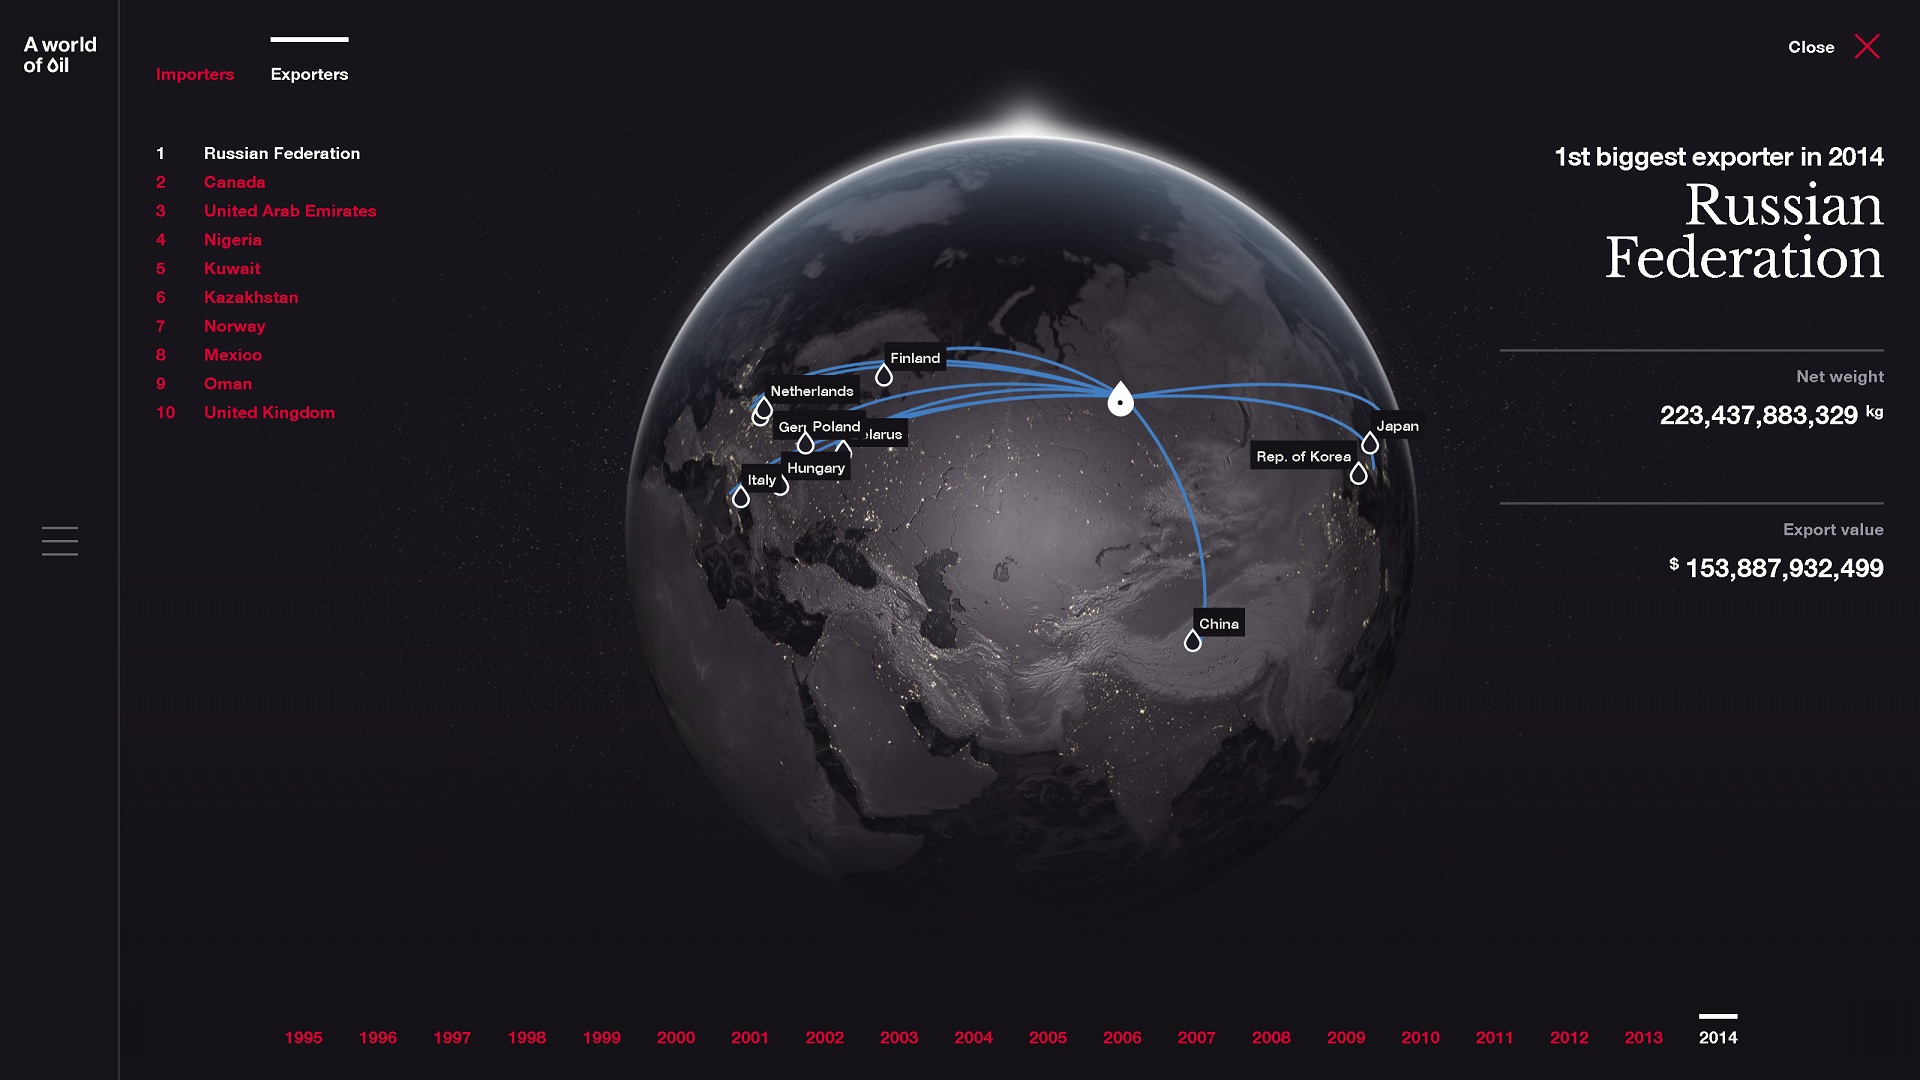
The data sourced by The United Nations Commodity Trade Statistics Database (UN Comtrade) – a repository of official trade statistics and relevant analytical tables – and show us the world’s ten biggest importers and exporters of oil for every year from 1995 to 2014 – and with a simple animation highlights each country’s ten biggest clients in each category. Website’s visitors can explore the data through an intentionally clean a minimalistic interface and simple topography and can reveal the net weight in kilograms and value in dollars when clicked on. The goal of simple icons and clean Helvetica typeface is not to distract the users from the visual impact of the oily globe.
The menu on the left side of the page can immerse into interesting points within the data with a series of stories named ‘Stories in Oil’ that help identify important trends and changes users can come across in global oil consumption. Epiphany Search built the site using front-end technologies, namely HTML, CSS and Javascript (ES6) to provide smooth animation of the lines and maximum visual impact. The website has also caught the attention of many oil and gas industry publications and won several awards, raising awareness for GSM London and its range of oil & gas undergrad and postgrad courses.
Credits: